

Climate change is the long-term shift in Earth’s average temperatures and weather patterns, driven today mainly by human activity that adds heat-trapping gases, such as carbon dioxide and methane, to the atmosphere. Burning coal, oil, and gas is the largest source. The result is a planet that is warming, with consequences that reach oceans, ice, ecosystems, and the weather people live with every day.
If you want the full foundation, what climate change is and how it works is a good place to start, and this article builds on it. Here, you’ll find the mechanism explained in plain language, the main components such as greenhouse gases and feedback loops, and the evidence scientists use to track change over time.
The topic is also in the news. The U.S. Environmental Protection Agency has revoked its greenhouse gas endangerment finding, the scientific determination that underpinned federal limits on climate pollution. And in October 2026, Climate Central published a new Climate Change Indicators dashboard that currently tracks eight indicators.
The science is the steady part of that story. Understanding it, and the real-world tools built on it, is the first step toward informed decisions.
What Climate Change Means: Weather, Climate, and the Greenhouse Effect
Start with a simple split: weather is what’s happening outside right now, and climate is the pattern those days add up to over decades. A cold snap in January doesn’t cancel out a warming trend, just as one rainy afternoon doesn’t make a place a rainforest. Scientists typically look at 30 years or more of data to describe a region’s climate, which smooths out the daily ups and downs.
Earth also has a natural thermostat of sorts, and it’s the reason life exists here. Sunlight warms the surface, the surface sends heat back toward space, and certain gases in the atmosphere catch some of that outgoing heat. Without this natural greenhouse effect, our planet would be a frozen world, far too cold for liquid oceans as we know them.
The issue today is that human activity, mainly burning fossil fuels, clearing forests, and certain farming practices, has added extra greenhouse gases to the air. More of these gases means more trapped heat, which strengthens an effect that was already in balance. Think of it as turning up a dial that nature had set at a livable level.
Here are a few core terms that will help as you read on:
- Weather
- The short-term state of the atmosphere in a specific place, such as today’s temperature, wind, or rainfall.
- Climate
- The long-term average of weather conditions in a region, usually measured over three decades or more.
- Greenhouse effect
- The natural process by which atmospheric gases absorb and re-emit heat, keeping Earth warm enough to support life.
- Greenhouse gas
- A gas, such as carbon dioxide or methane, that traps heat in the atmosphere.
- Climate indicator
- A measurable signal, like sea level or atmospheric carbon dioxide, that shows how the climate is changing over time.
It also helps to separate natural variability from human-driven change. Climate has always shifted on its own, thanks to things like volcanic eruptions, ocean cycles such as El Niño, and slow changes in Earth’s orbit. Those natural forces still matter. But the rapid warming recorded over the past century or so lines up with the rise in human-produced greenhouse gases, and that’s what researchers mean when they talk about modern climate change.
How Greenhouse Gases Warm the Planet
The Role of Carbon Dioxide, Methane, and Other Gases
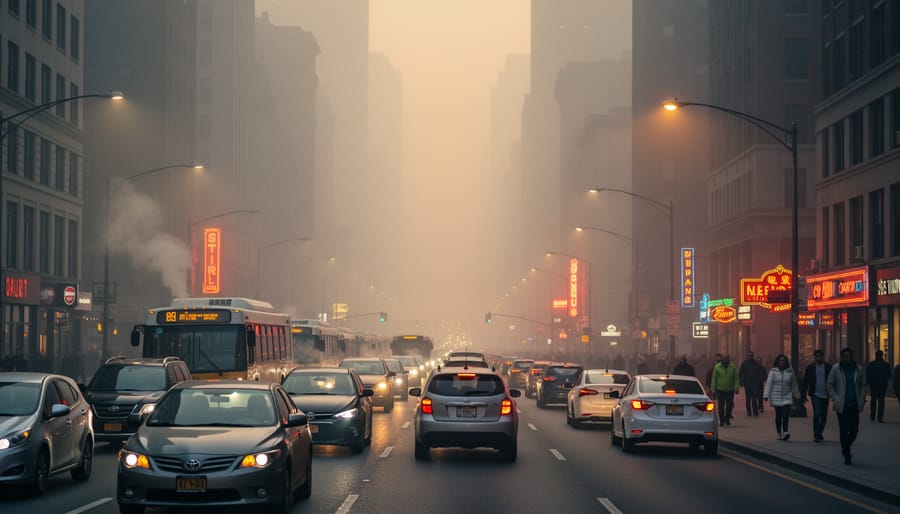
Not every greenhouse gas behaves the same way. Each one differs in where it comes from, how strongly it traps heat, and how long it lingers in the atmosphere. Together they form the main warming drivers of the climate system.
- Carbon dioxide: released mainly by burning fossil fuels and by clearing forests, and it is the largest driver because it builds up and persists for centuries.
- Methane: comes from livestock, rice farming, landfills, and leaks from fossil fuel systems, and it traps heat far more strongly per molecule but breaks down within roughly a decade.
- Nitrous oxide: linked to fertilizer use and some industrial processes, and it is a potent, long-lived gas.
- Fluorinated gases: produced by refrigeration, cooling, and industrial uses, and they are often extremely heat-trapping even in tiny amounts.
- Water vapor: a powerful greenhouse gas that mostly responds to warming rather than driving it directly.
Potency and lifetime are the key ideas here. A gas that absorbs heat strongly but disappears quickly, like methane, can drive rapid near-term warming. A gas that is less potent but lingers, like carbon dioxide, shapes the climate for generations because the carbon keeps cycling through the air, oceans, and land.
Sources matter too. Energy production and transport dominate carbon dioxide emissions, agriculture is a major source of methane and nitrous oxide, and land use changes can both release carbon and reduce nature’s ability to absorb it. Understanding these differences helps researchers and planners decide where cuts will have the biggest effect.
Feedbacks That Amplify or Dampen Warming
Climate feedbacks are the loops that explain why a modest push can grow into a bigger change. The core idea is simple: warming sets off other processes, and those processes either add to the warming or work against it.
The ice-albedo feedback is a classic amplifier. Bright ice and snow reflect sunlight back to space. As they melt, they expose darker ocean or land, which absorbs more heat and encourages further melting. Water vapor works similarly. A warmer atmosphere holds more moisture, and because water vapor is itself a greenhouse gas, it strengthens the original warming.
Carbon cycle responses can push in either direction. Plants and oceans currently absorb a large share of the carbon dioxide people emit, which dampens warming. But warmer oceans hold less dissolved gas, and thawing permafrost can release stored carbon, which would amplify it.
Scientists study these feedbacks closely because they shape how sensitive the climate is overall. Researchers can measure and model each loop, and that growing precision helps narrow the range of future outcomes.
How Scientists Track Climate Change: Sea Level, Carbon Dioxide, and Other Indicators
No single thermometer or satellite settles the question of a changing climate. Researchers rely on many independent lines of evidence that are collected by different teams, with different instruments, and then compared against one another. When they point the same way, confidence grows. This convergence is a big part of why the scientific consensus is so firm.
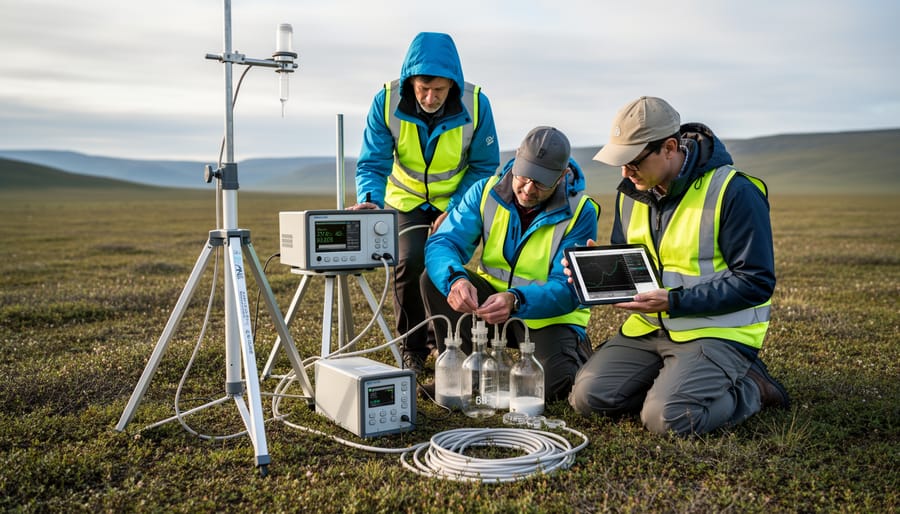
Start with carbon dioxide. Instruments on mountaintops, towers, ships, and satellites sample the air continuously, and ice cores preserve trapped bubbles of ancient atmosphere for comparison. Because burning fossil fuels adds carbon dioxide to the air, these records let scientists see how the gas has accumulated and trace its chemical fingerprint back to its source. This is core work in atmospheric science.
Temperature records come from weather stations, ocean buoys, and satellites, each cross-checked against the others. Sea level is measured by coastal tide gauges and by satellites that bounce radar off the ocean surface. It rises for two main reasons. Water expands as it warms, and meltwater from glaciers and ice sheets adds new volume to the sea. That is why ice loss and ocean heat content sit alongside the surface indicators. The oceans absorb most of the extra heat trapped by greenhouse gases, so tracking their warmth reveals changes the air temperature alone can miss.
Taken together, multiple climate indicators give a fuller picture than any one measurement could. Each reflects a different part of the same system.
Making this data easy to explore matters too. Climate Central’s Climate Change Indicators dashboard, published on October 21, 2026, currently tracks eight indicators, bringing scattered datasets into one place. Tools like this let students, journalists, and curious readers follow the trends themselves rather than relying on summaries alone. Regulations may shift, but the measurements keep coming, and anyone can now watch them unfold.

What the EPA Endangerment Finding Is and Why Its Repeal Matters
The “endangerment finding” is a scientific and legal determination that greenhouse gases threaten public health and welfare. That conclusion gave the federal government the authority to limit climate pollution, and it underpinned a range of U.S. regulations on greenhouse gas emissions.
The Environmental Protection Agency has now revoked that finding. According to reports on the announcement, the move discards the scientific determination that empowered the government to limit climate pollution. Here is what has been reported, stated as precisely as the sources allow:
- The EPA has revoked its greenhouse gas endangerment finding.
- The repeal eliminates all greenhouse gas emissions standards for cars and trucks.
- The EPA said it will propose a two-year delay to a Biden-era rule.
Beyond these points, details such as how the changes will be implemented are not covered here, since they have not been confirmed in the reporting this article relies on.
So what does this mean for U.S. climate policy? In practical terms, the finding worked as a foundation. With it in place, agencies could set emissions standards for sources like vehicles. With it revoked, that regulatory footing changes, and the vehicle standards tied to it are among the first affected. How the decision plays out over time, including whether it faces challenges, is a question this article will not try to answer.
It helps to separate two ideas that often get blended together. A regulation is a policy choice, and policy choices can change with each administration or court ruling. The physics of the greenhouse effect is different. As the earlier sections explained, greenhouse gases trap heat, and that understanding rests on decades of independent measurements, not on any agency’s legal status. A change in what the government requires does not change what the atmosphere does.
That distinction is useful whichever way you view the decision. Whatever the regulatory landscape looks like, researchers continue to track temperature, carbon dioxide, and sea level, and engineers continue to develop low-carbon energy technologies that can reduce emissions. Policy shapes how quickly and in what ways society responds, but the underlying science remains a stable reference point for anyone trying to make sense of the debate.
How Climate Science Is Applied in the Real World
Climate science does not stay in the lab. The same measurements that tell us how the planet is warming now guide decisions about where to build, what to plant, and how to power our homes. That is where the field becomes most hopeful, because understanding a problem is the first step toward managing it.
Researchers often describe this link between data and decisions in simple terms. As one climate scientist might put it, good observations let communities plan for the future they are likely to face rather than the one they remember. The work falls into a few practical areas:
- Modeling and forecasting: Improved climate models help planners estimate future heat, rainfall, and storm patterns.
- Coastal and infrastructure planning: Sea level and flood projections guide where to raise roads, redesign drainage, or relocate vulnerable facilities.
- Agriculture adaptation: Seasonal and long-range forecasts help farmers choose crop varieties and adjust planting and irrigation.
- Clean energy deployment: Wind and solar resource data show where renewable projects will perform best.
- Carbon capture research: Laboratory and field studies test ways to remove or store carbon dioxide more efficiently.
- University-led monitoring: Long-running field stations and satellite analysis keep the evidence base current and openly available.
These applications fall into two broad families of response. Cutting emissions addresses the cause, while preparing for change addresses the consequences already underway. If you want a deeper look at how mitigation and adaptation work together, that guide walks through the logic of pursuing both at once.
What makes this progress encouraging is how much of it is cumulative. Each new dataset sharpens the models, better models improve planning, and better planning reduces risk. Even as regulations shift, the scientific toolkit keeps improving, and a growing share of it is shared openly so that city planners, farmers, engineers, and students can all put it to work.
Common Questions About Climate Change
What is the endangerment finding?
It was a scientific determination that greenhouse gases endanger public health and welfare. That determination gave the federal government the authority to limit climate pollution. The EPA has now revoked it.
Why does greenhouse gas pollution matter?
Greenhouse gases like carbon dioxide and methane absorb heat that would otherwise escape to space. As their concentrations rise, more energy stays in the climate system, which shifts temperature and weather patterns over time. Cutting emissions slows that buildup.
How is climate change affecting sea level and carbon dioxide?
Warming raises sea level because ocean water expands as it heats and because land ice melts and adds water to the sea. Carbon dioxide levels in the atmosphere have climbed as fossil fuel burning and land use release more of it than natural systems absorb. Both are among the indicators scientists track, including on public dashboards like Climate Central’s, which follows eight indicators.
What does the EPA repeal mean for U.S. climate policy?
The repeal eliminates all greenhouse gas emissions standards for cars and trucks. The agency also said it will propose a two-year delay to a Biden-era rule. What happens next depends on future rulemaking and decisions beyond what has been announced.
Taken together, these answers point to one idea: the physical science and the policy conversation move on separate tracks. Regulations can change quickly, but the way greenhouse gases trap heat does not depend on any rule, which is why open data and ongoing monitoring remain so useful for anyone trying to understand where the climate is headed.
Climate change is a long-term shift in global temperature and weather patterns, driven largely by the greenhouse gases we add to the atmosphere. Those gases absorb heat the surface sends back toward space and re-radiate it, so more of the sun’s energy stays in the system. That single mechanism connects everything covered here, from rising carbon dioxide to changing sea levels.
Researchers confirm this through several independent indicators, and tools like Climate Central’s Climate Change Indicators dashboard, published on October 21, 2026, make that evidence easier for anyone to explore. Policy will keep evolving, including the EPA’s revocation of the endangerment finding, but the physics of warming doesn’t change with regulatory status. Scientific understanding keeps deepening either way.
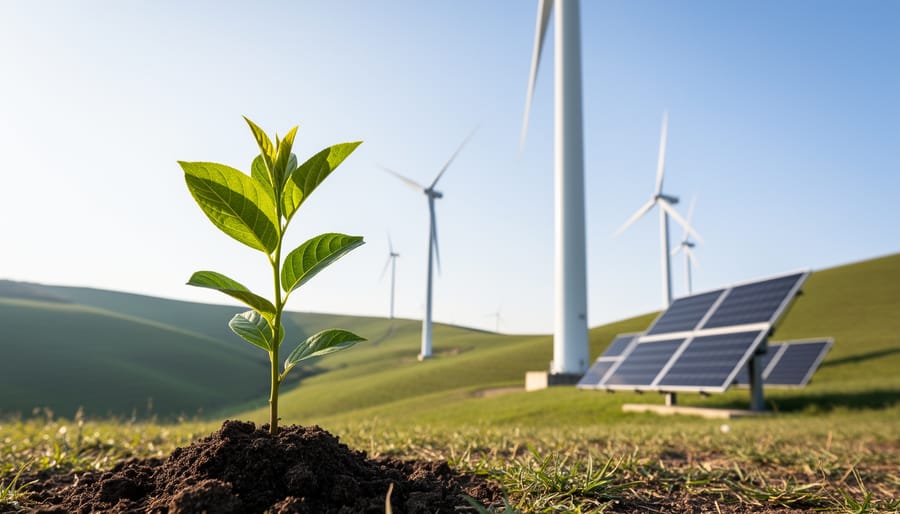
That’s genuinely encouraging. Open data, better models, and steady innovation in clean energy and monitoring give us more insight than ever before. Take a look at public climate datasets, follow the work of university research teams, and stay curious. The more people understand the science, the better our collective decisions can be.