
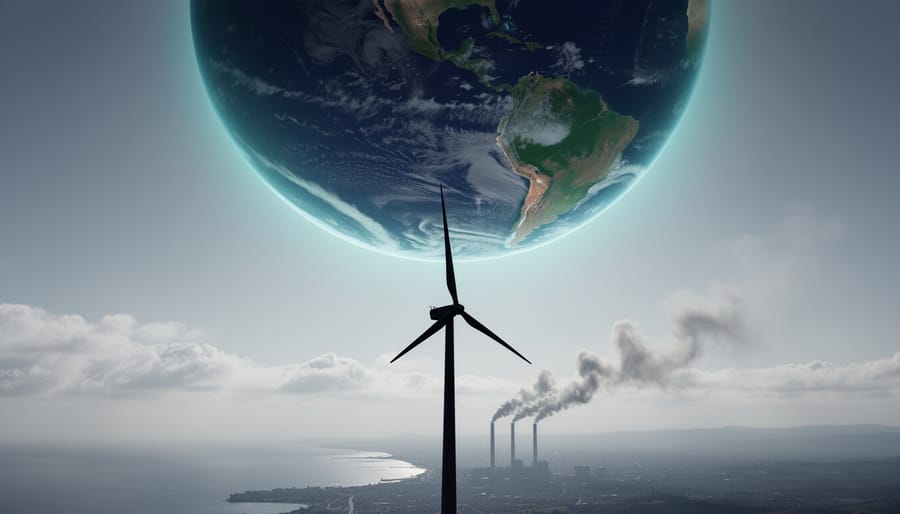
Climate change is the long-term shift in Earth’s average temperatures and weather patterns, and today it is driven mainly by human activity. Burning coal, oil, and gas, clearing forests, and farming at scale release greenhouse gases that trap heat in the atmosphere, much like a blanket that keeps getting thicker. The planet’s natural climate has always varied. What’s different now is the speed, and the fact that we can trace the cause.
That matters because the effects don’t stay abstract. They show up in how cities plan for heat, how farmers manage land, and how emergency teams prepare for storms. In the United States, greenhouse gas emissions from human activities rose by 7 percent between 1990 and 2014, a reminder that the trend line is built from everyday choices in energy, transport, and land use. Assessments like the Fourth National Climate Assessment Vol. II were written precisely so that public health officials, utility managers, and planners could understand what those changes mean for communities.
There’s an encouraging side, too. Tools for measuring emissions and carbon removals from agricultural land, such as the Land Sector and Removals Guidance for companies, show that science is turning into practical, trackable action. This explainer starts with the plain-language basics, then covers how the greenhouse mechanism works, what drives it, and where the knowledge is being put to use.
What Climate Change Means: A Plain-Language Definition
Climate change is a long-term shift in the average weather patterns of a region or the whole planet, measured over decades rather than days. The key word is “average.” A cold snap in April or a record-breaking storm tells you about the weather. The pattern of temperatures, rainfall, and storms across thirty years or more tells you about the climate.
Earth’s climate has always varied naturally. Volcanic eruptions, shifts in the sun’s output, and slow changes in Earth’s orbit have all nudged temperatures up and down across millennia. What sets the current era apart is the cause. Scientists attribute most of the warming of recent decades to human activity, mainly burning fossil fuels, clearing forests, and farming practices that release heat-trapping gases into the atmosphere.
You will often see the terms “global warming” and “climate change” used side by side. Global warming refers specifically to the rising average surface temperature. Climate change is the broader phrase, covering the knock-on effects too, such as shifting rainfall, melting ice, rising seas, and changes in extreme weather. That wider scope is part of why the topic keeps drawing so many searches: it touches food, health, infrastructure, and planning decisions for ordinary people and large organizations alike.
A few terms come up constantly, so here is a quick glossary:
- Weather vs. climate
- Weather is what the atmosphere does in a particular place over hours or days. Climate is the long-term pattern of that weather, typically averaged over 30 years or more.
- Greenhouse gas
- A gas, such as carbon dioxide, methane, or nitrous oxide, that absorbs and re-emits heat in the atmosphere.
- Greenhouse effect
- The process by which these gases trap part of the heat Earth radiates, keeping the lower atmosphere warmer than it would otherwise be.
- Carbon dioxide removal
- Methods that pull CO₂ out of the atmosphere and store it, from land-based approaches to emerging technologies.
- Mitigation vs. adaptation
- Mitigation reduces or prevents greenhouse gas emissions, while adaptation adjusts communities and systems to cope with the changes already underway.
With these basics in place, the next step is seeing how the warming mechanism itself works.
How the Greenhouse Effect Warms the Planet

Feedbacks and Why Small Changes Add Up
Warming rarely stays a one-time event, because the climate system can amplify or dampen itself through feedback loops. Take ice. Bright snow and ice reflect much of the sunlight that strikes them back toward space. As warming melts that surface, darker ocean or land is exposed, absorbing more energy and driving still more melting. The change feeds the cause.
Water vapor works the same way. A warmer atmosphere holds more moisture, and water vapor is itself a heat-trapping gas, so the initial warming from added carbon dioxide gets a boost. Scientists treat this as an amplifier rather than a starting trigger, since vapor levels respond to temperature rather than set it.
Then there are the oceans, the planet’s great heat sponge. Their sheer volume means they warm slowly, absorbing enormous amounts of energy before the full effect shows up. That lag has a practical consequence: some warming and sea level rise continue even after emissions slow, much like a heavy pot that stays hot long after the burner is turned down.
Put these pieces together and you can see why small nudges matter. Each feedback is modest alone, but they compound across decades, which is why effects persist and build rather than simply tracking the latest year’s emissions.
The Main Drivers and Signals of a Changing Climate

Three gases do most of the heat-trapping work that human activity adds to the atmosphere. Each comes from a different set of sources:
- Carbon dioxide (CO₂): released mainly by burning coal, oil and gas, and by clearing forests.
- Methane (CH₄): emitted by livestock, rice cultivation, landfills and leaks from fossil fuel systems.
- Nitrous oxide (N₂O): produced largely by fertilized soils and some industrial processes.
Carbon dioxide gets the most attention because of sheer volume and how long it lingers. Methane and nitrous oxide are far less abundant, but each molecule traps much more heat, so they matter well beyond their small share of the total.
Emissions leave a long paper trail. One historical data point from the Environmental Protection Agency’s records shows that U.S. emissions increased 7% from 1990 to 2014, counting greenhouse gases from human activities. That figure describes that specific 24-year window, not today’s totals, but it shows how steadily emissions can climb in a large, growing economy.
Scientists don’t rely on emissions numbers alone. They also track what the planet itself is doing, using several independent indicators that point in the same direction:
- Rising average surface and ocean temperatures.
- Higher global sea levels, driven by warming water and melting land ice.
- Shrinking glaciers, ice sheets and Arctic sea ice.
- Increasing ocean heat content, since the oceans absorb most of the extra energy.
- Shifting precipitation patterns, including heavier downpours in some regions and deeper dry spells in others.
No single indicator tells the whole story, which is exactly why researchers watch them together. When thermometers, tide gauges, satellites and ice measurements all agree, confidence in the overall picture grows.
Knowing the drivers and signals also shapes what people do about them. Cutting emissions at their source and preparing for changes already underway are the two halves of mitigation and adaptation and both depend on this kind of measurement.
How Climate Science Is Put to Work: Assessments, Accounting, and Real-World Decisions
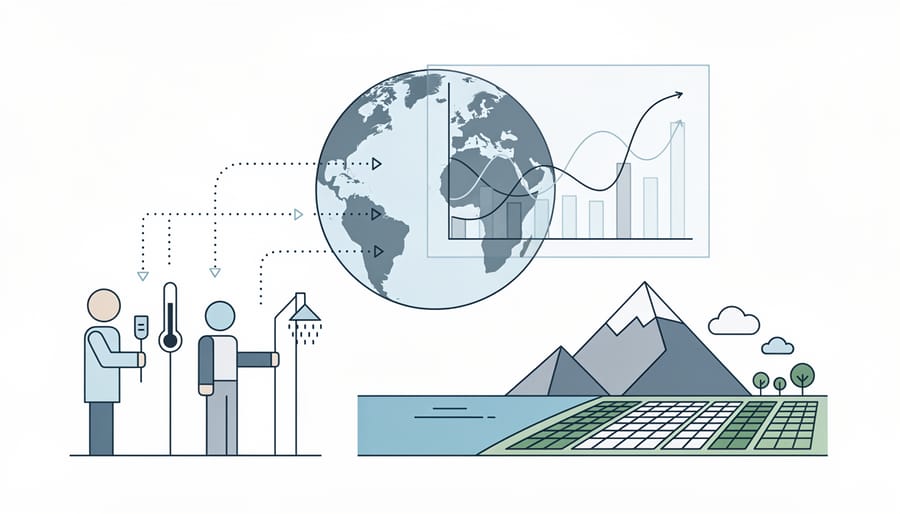
Knowing how the climate works only matters if someone can act on it. Two very different kinds of documents show how that translation happens: national assessments that map expected impacts, and accounting guidance that tells organizations how to count their emissions.
Start with assessments. The Fourth National Climate Assessment Vol. II is described as an authoritative climate assessment of how climate change affects the United States and its territories. It was written for people who have to make decisions with real consequences: utility and resource managers, public health officials, emergency planners, and other stakeholders. A water utility, for example, can use this kind of analysis to think about future supply, while a health department can anticipate which risks may grow in its region. The science becomes a planning input rather than an abstract warning.
Accounting is the other side of the coin. The Land Sector and Removals Guidance (version 1.0) gives companies practical detail on how to account for and report greenhouse gas emissions and CO₂ removals from agricultural land use and from emerging CO₂ removal technologies. It is a companion guidance for reporting alongside the Land Sector and Removals Standard, and the two documents share the same 20-chapter organization, so a reader can move between the rules and the how-to detail without losing their place. Land use matters here because farms and forests can both release carbon and, in some cases, store it. Clear counting rules help make those numbers comparable.
These tools also line up with the two broad responses to climate change. Mitigation aims to reduce the heat-trapping gases entering the atmosphere, or to remove some of what is already there. Accounting guidance supports that work by making emissions and removals measurable. Adaptation focuses on adjusting to the changes that are already underway or unavoidable, such as shifting risks to infrastructure, public health, and water supplies. Impact assessments feed directly into that second effort. Neither response replaces the other, and most serious planning draws on both.
Researchers increasingly pair these frameworks with new analytical methods. If you want to see how modern data tools are reshaping the field, explore how AI in climate science helps turn large environmental datasets into usable insight.
The pattern is worth remembering. Science describes what is happening and why, assessments clarify what it may mean for specific places and sectors, and accounting rules give organizations a shared language for tracking their own contribution.
Climate Change Explained: Common Questions
What is the Land Sector and Removals Guidance?
It is a companion resource to the Land Sector and Removals Standard. It gives companies practical detail on accounting for and reporting greenhouse gas emissions and CO₂ removals from agricultural land use and emerging CO₂ removal technologies. Both documents follow the same 20-chapter organization, and the guidance is available as version 1.0.
What is the Fourth National Climate Assessment Vol. II?
It is an authoritative assessment of the impacts of climate change on the U.S. and its territories. It was written to help decision-makers, utility and resource managers, public health officials, emergency planners, and other stakeholders understand how climate change affects the United States.
Which gases do climate indicators typically focus on?
Most indicators track carbon dioxide, methane, and nitrous oxide, along with other heat-trapping gases. Each absorbs infrared radiation in the atmosphere, which is why their rising concentrations matter for warming.
What is the difference between weather and climate?
Weather describes short-term, local conditions such as today’s rain or this week’s heat. Climate is the pattern of those conditions averaged over many years, typically several decades.
Readers often follow these answers with a bigger question about where the science leads next, such as is climate change reversible. The short version is that some changes unfold slowly and persist, which is exactly why the planning and accounting tools above exist. They turn research into decisions people can act on.
The core idea of climate change is simple, even if the details are not. Greenhouse gases trap heat that would otherwise escape to space, and human activity has thickened that natural blanket by adding more of them. That is the physical story behind a changing climate.
What makes the topic hopeful is how the science is used. Assessments like the Fourth National Climate Assessment Vol. II help decision-makers, public health officials, and emergency planners understand local impacts. Tools like the Land Sector and Removals Guidance give companies practical ways to account for emissions and CO₂ removals from agricultural land and emerging removal technologies. Research becomes planning, and planning becomes action.
Understanding the mechanism is the first step toward making informed choices, whether you are a student, a professional, or a curious reader. Climate research keeps advancing, so keep following it, and keep asking how the evidence connects to the decisions being made around you.