
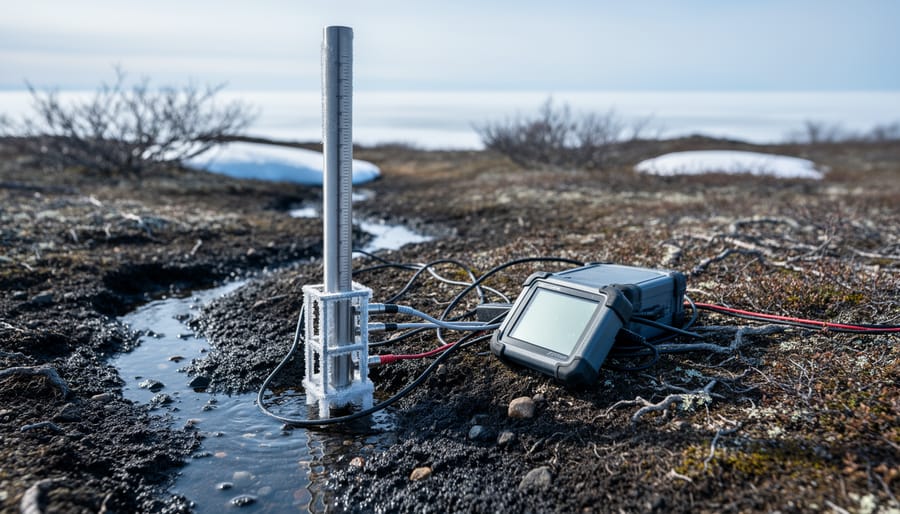
Climate change in the Arctic is the rapid warming of the planet’s northernmost region, which is heating faster than the global average and reshaping its sea ice, snow cover, permafrost, and ice sheets. The cause is the same one driving change everywhere, but the Arctic amplifies it. Bright, reflective ice gives way to darker ocean and land, which absorb more heat and speed the cycle along. If you want the broader foundation first, our explainer on how climate change works covers the basics.
The numbers are worth reading carefully. Arctic sea ice extent for September 2026 was 5.34 million square kilometers, the 16th lowest September extent on record, though the fifth highest since 2007. That’s a useful reminder that the long-term decline plays out through year-to-year swings, not a straight line. Snow cover tells a similar story. In 2025, it was roughly normal across Eurasia and North America in May, then dropped below normal in June with an early loss of snow.
These shifts matter well beyond the polar circle. More than 4 million people live in the Arctic, roughly 1 in 10 of them Indigenous, and they face the changes first. This article explains what’s happening, why the Arctic responds so strongly, which indicators researchers track, and how communities and decision-makers are putting that knowledge to work.
What Climate Change in the Arctic Means
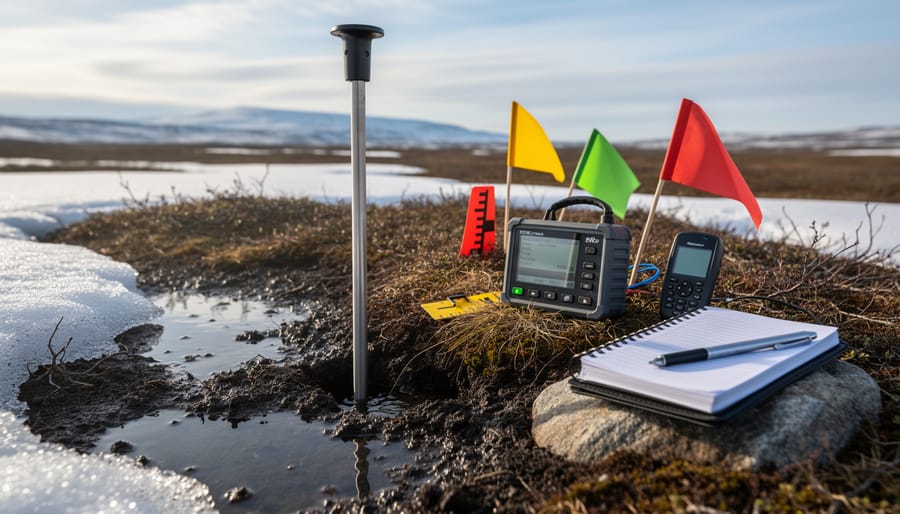
Climate change in the Arctic refers to the long-term warming and related environmental shifts across the northern polar region, a place that has been changing faster than many other parts of the world. Researchers are tracking changes in sea ice, snow cover, ice sheets, permafrost and the ecosystems that depend on them. If you’re new to the topic, our overview of the science work behind climate change offers helpful background.
A few core terms come up again and again:
- Sea ice extent
- The total area of ocean where sea ice covers at least a set fraction of the surface, usually reported in millions of square kilometers.
- Snow cover extent
- The area of land blanketed by snow at a given time, which researchers track across Eurasia and North America.
- Ice sheet surface melt
- Melting at the top of a large land ice mass such as Greenland’s, measured by how much of the sheet shows melt conditions.
- Permafrost
- Ground that stays frozen for at least two years in a row, often storing ancient carbon and supporting the landscape above it.
- Sea ice minimum
- The lowest point in the yearly cycle of sea ice, which typically arrives in mid-September.
So how do scientists separate a long-term trend from natural variability? They look at many indicators over many years, rather than any single season. Key indicators of the state of the climate system and human influence include sea ice extent, snow cover, ice sheet melt and permafrost conditions. Together they paint a picture that no single measurement can.
This is why year-to-year swings don’t erase the bigger story. September 2026 sea ice extent was 5.34 million square kilometers, the 16th lowest September extent on record but the 5th highest since 2007. That’s a useful reminder that individual years fluctuate. Snow cover tells a similar tale: in 2025 it was roughly normal in May, then dropped below normal in June.
The Arctic matters to researchers partly because these changes ripple outward. The region is home to more than 4 million residents, and it’s tied into wider patterns of climate and biosphere change. Watching the Arctic closely helps scientists spot shifts early and understand how connected Earth’s systems really are.
How Warming Reshapes the Arctic: The Mechanisms at Work
Sunlight, Ice, and Feedback Loops
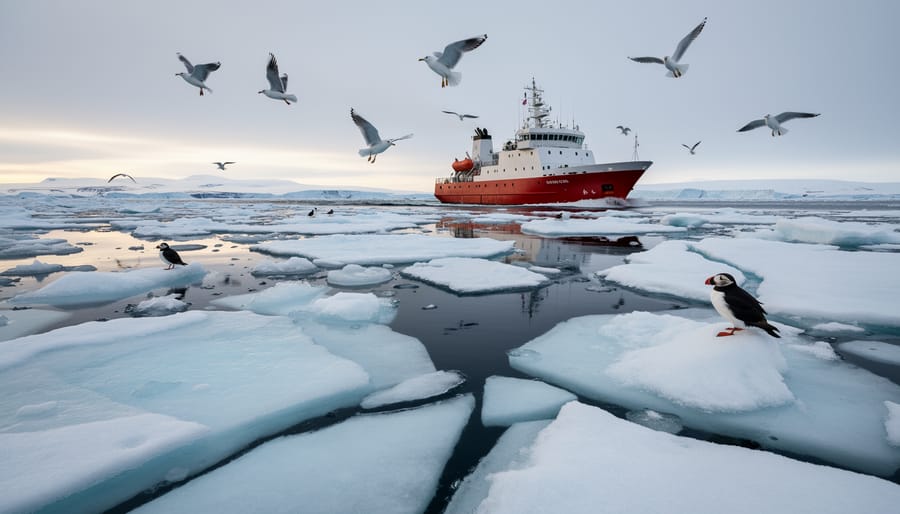
Picture a researcher standing on a floe in late summer, squinting against the glare. The surface is bright white, and most of the sunlight hitting it bounces straight back to space. A few weeks later, the same spot is dark open water, and the scene has flipped: the sea soaks up that light instead of reflecting it.
That flip is the heart of the ice-albedo feedback. Albedo simply means how reflective a surface is. Fresh ice and snow have high albedo, while open ocean has low albedo. When warming melts some ice, the exposed water absorbs more solar energy, which warms the water and melts more ice, which exposes still more dark water. Each step nudges the next one along, which is why scientists call it a feedback loop.
This is one reason the Arctic is such a focus for research. Changes at the surface can amplify themselves locally rather than simply fading away.
It helps to keep the picture in proportion, though. The feedback is one mechanism among several, and it works alongside ocean heat and atmospheric patterns. Year-to-year conditions also vary, so a single season doesn’t tell the whole story. What the loop explains is why a small shift in reflective surface can matter more than its size suggests.
Ocean, Atmosphere, and Land Connections
The Arctic behaves less like a collection of separate parts and more like one connected machine. Warm ocean water can thin ice from below, while shifting atmospheric patterns move heat and moisture across the region. That moisture falls as snow, and snow cover then changes how much sunlight the land surface absorbs or reflects. When snow disappears early, as it did in June 2025 across parts of Eurasia and North America, the bare ground warms faster, which can feed back into air temperatures above it.
The Greenland ice sheet shows the same linkage. In September 2022, unusually late warming brought surface melt conditions to 36% of the ice sheet, a reminder that atmospheric events can leave a visible mark on ice that took millennia to build.
This is why the Arctic Research Plan 2022-2026 names Arctic Systems Interactions as a priority. Tracking sea ice alone, or snow alone, misses how one change nudges another. Monitoring the ocean, atmosphere, snow, and ice sheets together lets researchers see cause and effect across the whole system, and it gives forecasters a more complete picture to work from.
The Components Scientists Track: Sea Ice, Snow, and Ice Sheets
Sea Ice: A Mixed Picture in 2026
September 2026 brought a mixed picture for Arctic sea ice. Extent for the month averaged 5.34 million square kilometers, the 16th lowest September on record but the fifth highest since 2007. The U.S. National Ice Center determined that the 2026 Arctic sea ice minimum occurred in mid-September, the point when the ice stops shrinking for the year and begins to rebuild.
At first glance, a “fifth highest since 2007” ranking might sound like a reversal. It isn’t, and scientists are careful about why. That comparison covers a window that begins in the late 2000s, a period already marked by unusually low extents. Being near the upper end of that window still leaves 2026 well down the list of all Septembers since satellite records began.
Sea ice also swings from year to year. Summer weather, winds that push ice around, and ocean conditions can all nudge a single season higher or lower without changing the underlying direction. Researchers therefore look at decades of data, not one September, to judge change.
So 2026 is best read as one data point in a long record. It shows how much natural variability sits on top of the long-term decline, which is exactly why continuous monitoring matters.
Snow Cover and the Greenland Ice Sheet
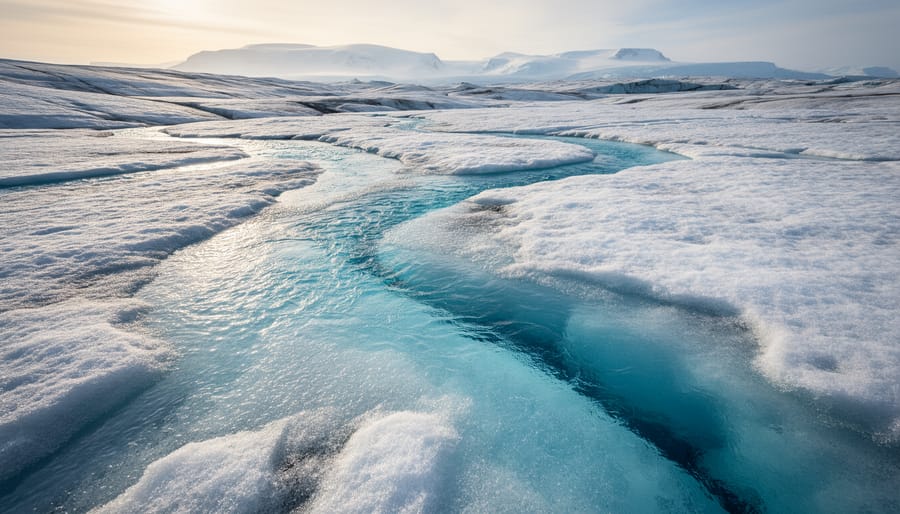
Snow cover and the Greenland ice sheet show how monitoring programs capture variability alongside long-term change. Take 2025: May 2025 snow cover was roughly normal across Eurasia and North America. By June, though, extent dropped below normal, with snow disappearing earlier than expected. A single month can look unremarkable, and the following month can tell a different story, which is why researchers track the full seasonal arc.
Greenland offers another example. In September 2022, the ice sheet experienced unprecedented late-season warming, producing surface melt conditions over 36% of its area. Melt that late in the year is unusual, and capturing it required the kind of consistent observation that lets scientists spot an anomaly when it happens.
Neither event defines a trend alone. Together, they illustrate what a well-built monitoring record is designed to do: flag notable departures so researchers can place them in context.
How Arctic Climate Research Is Used: From Data to Decisions
Supporting Arctic Communities
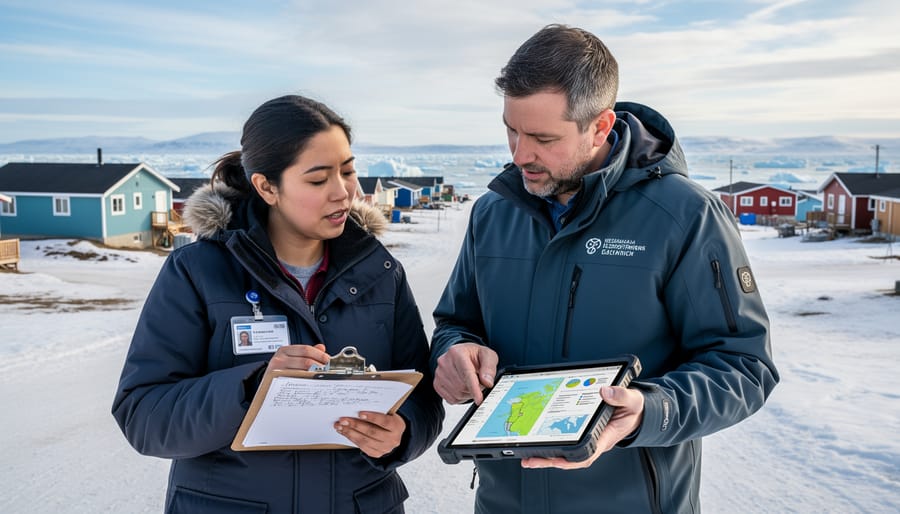
Rapid environmental change doesn’t land on an empty map. More than 4 million people live in the Arctic, and roughly 1 in 10 of them belong to Indigenous communities. For these residents, shifting conditions add to challenges they already face, from the reliability of local infrastructure to everyday health and well-being.
That is why research here goes beyond measuring ice and snow. Community Resilience and Health is one of the four Arctic research priorities guiding the Arctic Research Plan 2022-2026, sitting alongside Arctic Systems Interactions and Risk Management. Placing people inside the research agenda reflects a simple idea: the best science is the kind that communities can actually use.
In practice, that points toward partnership. When researchers work alongside residents, local knowledge and long-term observation can shape which questions get asked and how findings are shared. Indigenous communities often hold generations of firsthand understanding of their environment, and that perspective complements instruments and models rather than replacing them.
The goal is steady, practical support: clearer information for planning, stronger health and resilience strategies, and decisions informed by the people who live with the results every day.
Risk Management and Better Predictions
Every forecast starts with observation. Satellite and surface records of sea ice, snow cover, and the Greenland ice sheet feed the models that planners rely on, and those models are only as good as the data behind them. A single season can tell you what happened. A long record tells you what it means.
That’s why a figure like September 2026’s 5.34 million sq km of sea ice, the 16th lowest September extent on record, is useful mainly as a point on a longer curve. Pair it with the 2025 snow cover pattern, roughly normal in May and then below normal in June, and the 2022 Greenland melt event covering 36% of the ice sheet, and forecasters get a fuller picture of how variable the system can be. Risk Management is one of the four priority areas of the Arctic Research Plan 2022-2026, which reflects how closely this monitoring work is tied to practical decisions.
Newer methods are speeding this work up, too. Machine learning can sift huge observational datasets for patterns people might miss, a theme explored in this look at AI and environmental science. Better tools won’t replace sustained field and satellite observation, but they can help turn it into forecasts people can actually use.
Common Questions About Climate Change in the Arctic
What are the key indicators of the state of the climate system and human influence?
Researchers track measurements such as sea ice extent, snow cover, and the condition of ice sheets like Greenland’s, then compare them against long-term records. Watching these together helps scientists separate natural year-to-year swings from lasting trends linked to human activity.
What areas does the Arctic Research Plan 2022-2026 prioritize?
The plan prioritizes four areas, including Arctic Systems Interactions, Community Resilience and Health, and Risk Management. Together they connect basic observation with practical support for the people who live in the region.
How many residents live in the Arctic?
More than 4 million people live in the Arctic, and roughly 1 in 10 of them are part of Indigenous communities. Rapid environmental change adds to the challenges these residents already face.
Why can a single year’s sea ice ranking differ from the long-term trend?
Weather patterns, ocean conditions, and the timing of melt all vary from year to year, so one season can look better or worse than its neighbors. September 2026 is a good example: its extent of 5.34 million sq km was the 16th lowest on record yet the 5th highest since 2007, which is why scientists read the whole record rather than a single data point.
The thread running through these answers is that good decisions depend on both careful observation and thoughtful response. Strategies for reducing emissions and preparing for change, often described together as mitigation and adaptation rely on the kind of monitoring and community-informed research outlined throughout this article. Each new season of data adds context, helping researchers and residents alike plan with greater confidence.
Climate change in the Arctic is a story of connected systems. Sea ice, snow cover, ice sheets, ocean and atmosphere all respond to one another, and a shift in one can ripple through the rest. That’s why researchers track them together and look for long-term patterns rather than reading too much into any single year.
The 2026 sea ice figures show how this works in practice. A relatively high ranking for recent years sits comfortably alongside a longer record of change, and sustained observation is what makes that context visible.
The research is also meant to be used. Priorities like community resilience and health and risk management keep the focus on the people who live in the region, and on decisions that benefit from reliable data. There’s real reason for optimism in that combination of steady monitoring and partnerships grounded in community knowledge. To keep learning, follow continuing Arctic research news as new observations arrive.