
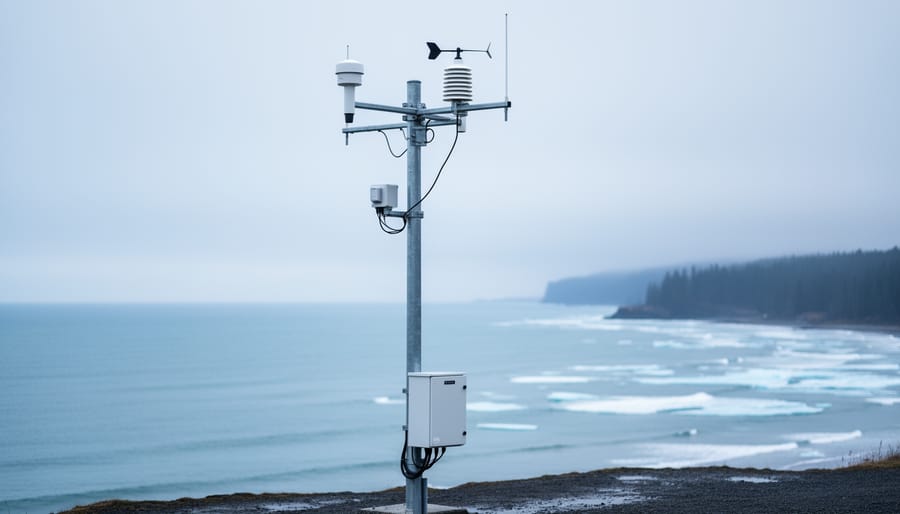
The year 2026 is virtually certain to rank among the four hottest years ever recorded, according to Canadian climate scientists who released their annual global mean temperature forecast this month. This projection isn’t speculation. It’s the result of sophisticated modeling that integrates real-time atmospheric data, ocean temperature patterns, and established climate trends to predict what the planet will experience over the coming months.
Environment and Climate Change Canada’s forecast arrives as researchers worldwide intensify efforts to track how quickly warming is accelerating and what that means for ecosystems, economies, and communities. The science is clear: each passing year adds more evidence to a decades-long warming trend that’s reshaping weather patterns, ocean currents, and ice coverage at rates that outpace historical norms.
What makes this year’s outlook particularly significant is the convergence of multiple monitoring efforts. Beyond temperature forecasts, Canada’s Climate Action 2026 report, now in its third year, offers a detailed assessment of the nation’s progress toward net-zero emissions. Using a Climate Action Barometer alongside six Sectoral Indices, the report evaluates policies, investments, and tangible actions across the economy. It draws on economic, consumer, and industrial data to create a comprehensive picture of where climate action is succeeding and where gaps remain.
For anyone tracking climate science, 2026 represents a critical checkpoint. The data emerging this year will refine models, inform policy decisions, and clarify whether current mitigation strategies are bending the emissions curve fast enough to meet international targets.
What Changed: New Temperature Forecasts for 2026

Environment and Climate Change Canada’s latest release marks a significant shift in how confidently scientists can now predict near-term warming. The government’s annual global mean temperature forecast, published in early 2026, upgrades previous probability language to state that scientists are “virtually certain” this year will rank among the four hottest years ever recorded. That level of confidence reflects refinements in modeling techniques and an accumulated warming signal strong enough to make such projections with unprecedented certainty.
The shift from earlier forecasts is subtle but meaningful. Where past annual predictions hedged with terms like “likely” or “expected,” the 2026 forecast removes most ambiguity. This isn’t because the planet suddenly warmed faster than anticipated, but because the baseline has risen steadily and the modeling frameworks now integrate real-time data streams that sharpen year-ahead projections. The announcement sets the stage for deeper examination of how these forecasts are built, what tracking tools Canada has developed to monitor climate action progress, and why the 2026 projections carry weight beyond a single data point.
Key Developments in Climate Science Predictions
1. Government of Canada’s Annual Temperature Forecast Methodology
Environment and Climate Change Canada produces its annual temperature forecast by synthesizing data from multiple global climate models, then applying ensemble averaging techniques to generate a single projection with quantified uncertainty. The forecast uses global mean modeling that incorporates atmospheric observations, ocean heat content measurements, and greenhouse gas concentration trends collected throughout the previous year. Scientists run these inputs through simulation frameworks that account for natural variability, such as El Niño cycles and volcanic aerosol effects, alongside long-term anthropogenic warming signals.
The confidence language matters. When researchers state they are “virtually certain” that 2026 will rank among the four hottest years on record, they are assigning a likelihood greater than 99 percent based on statistical convergence across model runs. This threshold reflects both the strength of the warming signal and the reduced spread among individual model outputs. The methodology has evolved to capture shorter-term variability more accurately while maintaining robust long-term trend projection, which is why annual forecasts now carry higher certainty than they did a decade ago.
Canadian scientists layer historical temperature records, satellite-derived sea surface data, and reanalysis products into a composite baseline. They then project forward using scenarios that assume current emission trajectories continue without dramatic intervention. The result is not a single temperature value but a probability distribution, with the central estimate indicating where 2026 is most likely to fall relative to preindustrial levels. This approach allows policymakers to plan for heat-related risks with a clear understanding of the forecast’s reliability and the physical mechanisms driving the projection.
2. Climate Action 2026 Report and the Climate Action Barometer
Climate Action 2026 represents Canada’s third annual assessment of progress toward net-zero emissions, released as part of a structured reporting framework that holds the government accountable to its climate commitments. The report serves a dual purpose: documenting what has been achieved and identifying gaps where policy and investment need to accelerate. For researchers studying climate governance, this annual snapshot offers a methodical way to track whether national strategies translate into measurable outcomes.
At the center of the report sits the Climate Action Barometer, a composite measure designed to synthesize multiple data streams into a single progress indicator. Rather than relying on a single metric, the barometer integrates information from diverse sources to build a comprehensive view of Canada’s climate trajectory. It measures:
- Climate policies enacted at federal and provincial levels
- Public and private sector investments in clean energy and emissions reduction
- Actions taken by industry, consumers, and communities to lower carbon footprints
- Economic data tracking green sector growth and fossil fuel phase-down
- Consumer behavior shifts toward sustainable choices
- Industrial emissions trends and decarbonization initiatives
This multi-layered approach gives policymakers and stakeholders a clearer picture than emissions tallies alone can provide. The barometer reveals not just where Canada stands today, but whether the pace of change matches the ambition of net-zero targets.
The real-world value lies in its application. Federal and provincial governments use the barometer to identify which sectors are advancing and which lag behind, informing budget allocations and regulatory priorities. Business leaders consult it to benchmark their own climate strategies against national progress, while investors rely on the data to assess transition risks and opportunities in Canadian markets. Environmental organizations and civil society groups leverage the report to advocate for stronger action where gaps emerge, turning abstract commitments into concrete accountability.
3. Six Sectoral Indices Tracking Climate Action Progress
The six Sectoral Indices embedded in Climate Action 2026 break down national climate progress into discrete economic and environmental categories, making it possible to identify which parts of the economy are advancing and which are lagging. Unlike the overarching Climate Action Barometer, which provides a single summary score, these indices drill into transportation, electricity, buildings, heavy industry, agriculture, and waste management, the six sectors responsible for the bulk of Canada’s greenhouse gas emissions.
Each index applies RBC’s methodology to synthesize sector-specific data: policy implementation timelines, capital investment flows, technology adoption rates, and emissions intensity trends. For example, the electricity index might track the share of renewable capacity added in a given year alongside grid modernization spending, while the transportation index examines electric vehicle uptake, public transit expansion, and fuel efficiency standards. This granular approach reveals whether a sector is on pace to meet its interim targets or falling short.
The practical value for researchers and policymakers lies in early detection. If the buildings index shows stalled retrofit rates despite available incentives, that signals a need for revised funding mechanisms or regulatory adjustments. If heavy industry shows rapid decarbonization in one province but not another, analysts can study the policy differences and replicate success. The indices turn abstract national commitments into trackable, actionable metrics.
By comparing sectoral performance year over year, stakeholders can allocate resources more efficiently, directing investment and political capital where intervention will yield the greatest impact. This targeted diagnostic function makes the indices a tool not just for accountability, but for strategic course correction as Canada navigates its net-zero trajectory.
Why These Projections Matter
The 2026 temperature forecasts and new tracking frameworks mark a turning point in how climate science informs action. When Canadian scientists declare it “virtually certain” that 2026 will rank among the four hottest years on record, that language carries weight beyond the numbers, it reflects consensus built on decades of refined modeling, satellite observations, and atmospheric measurements converging on the same stark trajectory. This isn’t speculation. It’s a projection grounded in methods rigorous enough that researchers stake their credibility on the outcome before the year even concludes.
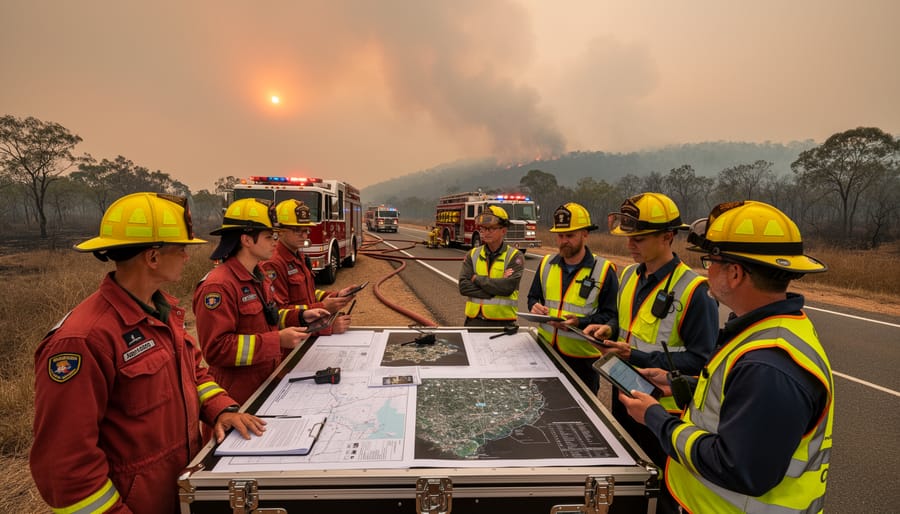
That certainty matters because it narrows the window for wishful thinking. Policymakers can no longer treat warming as a distant or debatable future; the heat is measurable now, and the tools to track our response, like the Climate Action Barometer and its six sectoral indices, create accountability in real time. These frameworks transform abstract commitments into observable progress, revealing which sectors are advancing and which are stalling. Infrastructure planners use temperature projections to design flood defenses, upgrade power grids, and rethink urban cooling. Disaster preparedness agencies adjust evacuation routes and stockpile resources based on forecasts that anticipate more frequent heatwaves and extreme weather. Investors shift capital toward renewable energy and climate-resilient technologies, guided by data showing where action aligns with net-zero targets.
The connection to global climate commitments is direct. Canada’s progress reports offer a model for transparent tracking that other nations can adopt, creating pressure for comparable disclosure and benchmarking. Improved modeling doesn’t just predict warming, it reveals leverage points where mitigation and adaptation investments deliver the most impact. Public awareness grows when people see the science working in real time, year after year, as forecasts prove accurate and reporting tools make progress tangible. That visibility turns climate data into a driver of decisions, not just a warning ignored.
What to Watch in the Months Ahead

As 2026 progresses, several key developments will shape our understanding of this year’s climate trajectory and the effectiveness of mitigation efforts. Monthly temperature data releases from Environment and Climate Change Canada will confirm whether the projection holds true, offering real-time validation of the forecasting methods and clarifying where 2026 ultimately ranks in the historical record. These updates provide crucial feedback loops for refining predictive models and adjusting climate response strategies.
The next edition of the Climate Action Barometer and its six Sectoral Indices, due later this year, will reveal whether Canada’s net-zero policies are translating into measurable progress. Watch for shifts in sectoral performance, particularly in transportation, energy, and industrial emissions, that signal where interventions are working and where gaps persist. These quarterly and annual snapshots give policymakers actionable intelligence to recalibrate investments and regulatory frameworks in near real time.
International climate forums will respond to these projections throughout the year, with the UN COP 2026 summit in Türkiye serving as a critical venue for nations to assess collective progress against warming benchmarks. Comparative analyses like Nepal’s 2026 update will highlight regional variations and underscore the interconnected nature of global climate action. These exchanges often catalyze new commitments and research collaborations.
For the public, following Environment and Climate Change Canada’s regular updates and annual progress reports offers accessible entry points into the science. The iterative nature of climate research, each forecast tested by observation, each policy tracked by data, demonstrates that responsive action remains possible. There’s genuine hope in 2026 when transparent monitoring systems show where we stand and illuminate pathways forward.
Frequently Asked Questions
What does ‘virtually certain’ mean in climate forecasting?
In climate science, ‘virtually certain’ indicates a probability of 99 to 100 percent that a projection will occur. When Canadian scientists use this term for the 2026 temperature forecast, they’re expressing near-absolute confidence based on current atmospheric conditions, ocean heat content, and model outputs.
How do the sectoral indices differ from the overall Climate Action Barometer?
The Climate Action Barometer provides a single, comprehensive measure of Canada’s climate progress by synthesizing economic, consumer, and industrial data across all sectors. The six Sectoral Indices break that down further, tracking specific areas like energy, transportation, and agriculture individually, which helps identify exactly where action is advancing or stalling.
Why is Canada’s progress report significant globally?
Canada’s Climate Action 2026 report demonstrates how a major economy tracks real-world climate commitments using transparent, data-driven methods. Other nations can adopt or adapt this approach, and the barometer methodology offers a model for measuring whether policies translate into measurable emissions reductions and sectoral transformation.
How can non-experts interpret these temperature projections?
Focus on the confidence level and the trend rather than precise decimal points. A ‘virtually certain’ forecast that 2026 ranks among the hottest years tells you warming continues unabated. Follow Environment and Climate Change Canada’s updates throughout the year to see how observations align with projections, and pay attention to the sectoral indices to understand where mitigation efforts are working.
These questions come up frequently because climate forecasting involves both hard science and policy application. Understanding confidence language helps you assess the reliability of predictions without needing a degree in atmospheric physics. The distinction between the overall barometer and sectoral indices matters for anyone trying to follow where Canada’s climate action dollars and policies are actually making a difference versus where gaps persist.
Canada’s approach has drawn attention because it ties policy commitments to measurable outcomes using a consistent methodology year over year. The third annual Climate Action 2026 report allows comparisons with the previous two years, revealing whether the pace of change is accelerating or plateauing. That transparency makes the Canadian framework useful for other countries designing their own tracking systems.
For readers who want to stay informed without getting lost in technical literature, bookmark Environment and Climate Change Canada’s updates and watch for the annual progress reports each year. These documents translate complex climate data into accessible summaries that show whether collective action is bending the emissions curve.